Search into this blog
Sunday 19 June 2016
Saturday 4 June 2016
ADANI PORT & SEZ Multiframe Technical Study - June 2016
Monthly Chart -
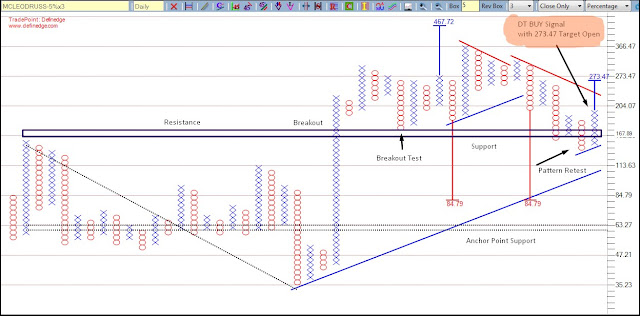
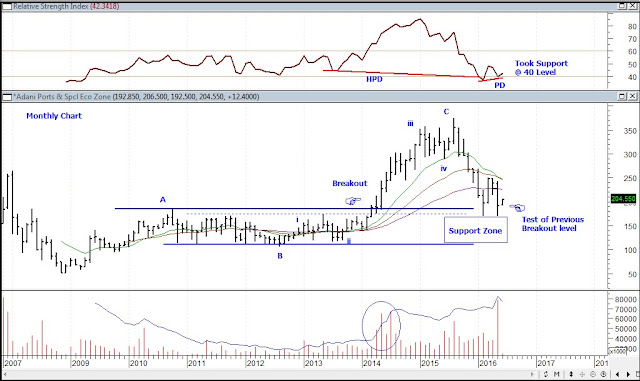 * Price Slide down after breakdown and making new high in 2015
* Currently Price tested the previous breakout level and support zone
* Support zone is between 100 - 170 level
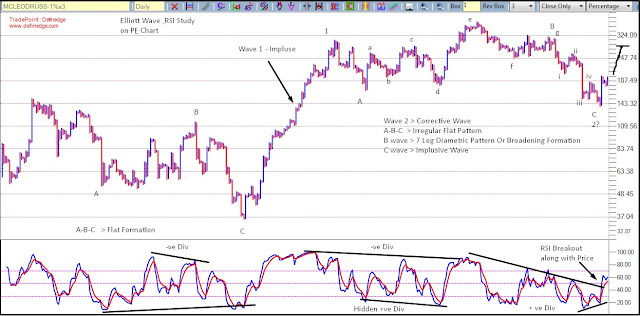
* As per Elliott wave, Previous complete upmove is Zigzag pattern of ABC wave of B wave of higher timeframe.
* Currently Down move is in C wave of higher timeframe.
* RSI is showing type2 positive Divergence after Hidden PD....
* Also Monthly RSI testing the 40 level of 80-40 bullish range.
Weekly Chart -
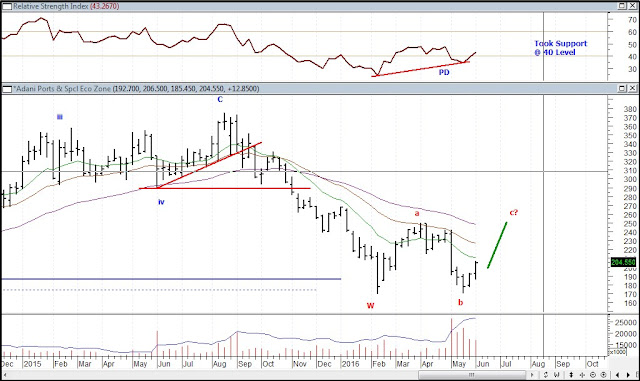
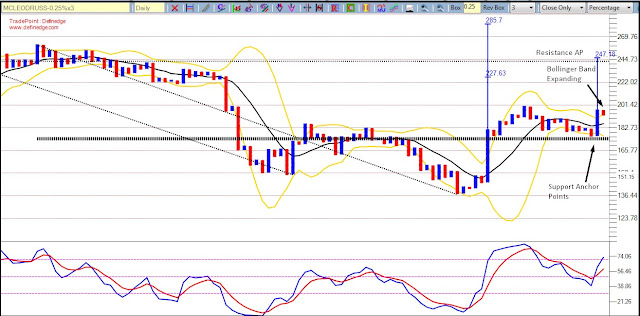
* After Making Low of 180.55, Price showing some strength and inching Northward slightly since 2 weeks.
* Any fall will be buying opportunity for the target of 250 in coming 2 months.
Daily Chart -
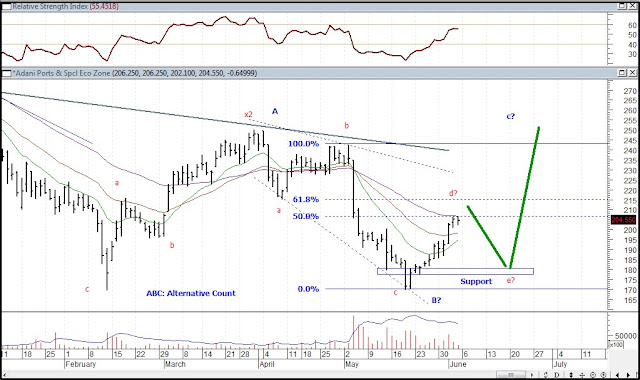
* As per above weekly chart, We are Flat correction pattern as ABC, but as per Neowave, price is not fulfilled the reversal condition and Hence this could be the part of previous downmove correction.
* Further Price movement will confirm the reversal Pattern
Adani Port: - Post Analysis Study
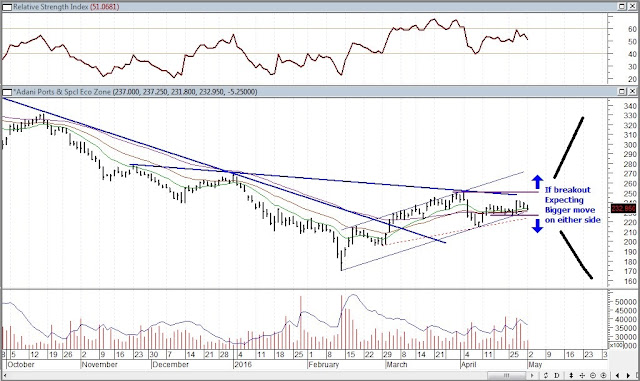
Due to time constraint, couldn't update the post daily for every analysis... One good post which was pending to update since long time... which we identify for Option Strangle setup on 3 May which was work very well.. .
Setup Study -
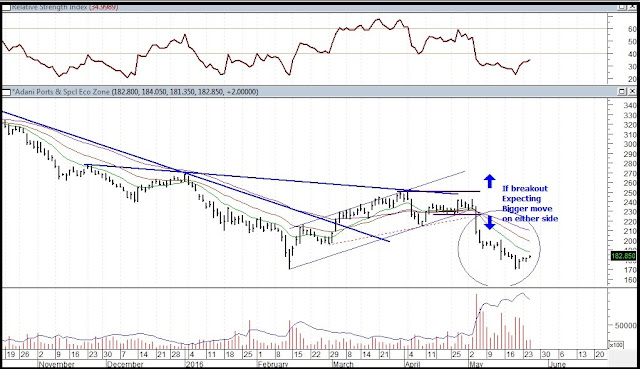
* Triangle Pattern on chart and Hence Break can expect on either side of the triangle which side don't know?
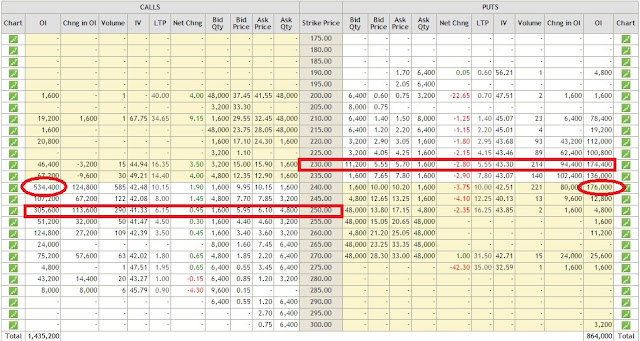
* Hence decided to play with Option strangle as volatility was expected due to result on next day.
* Selected the Strike price as per below
Anticipated and Happened : -
26 May 2016
See the result chart and Profit Potential of Strangle Option Trade -
Subscribe to:
Posts (Atom)
