Tech Mahindra - CMP 439.70
Monthly Chart -

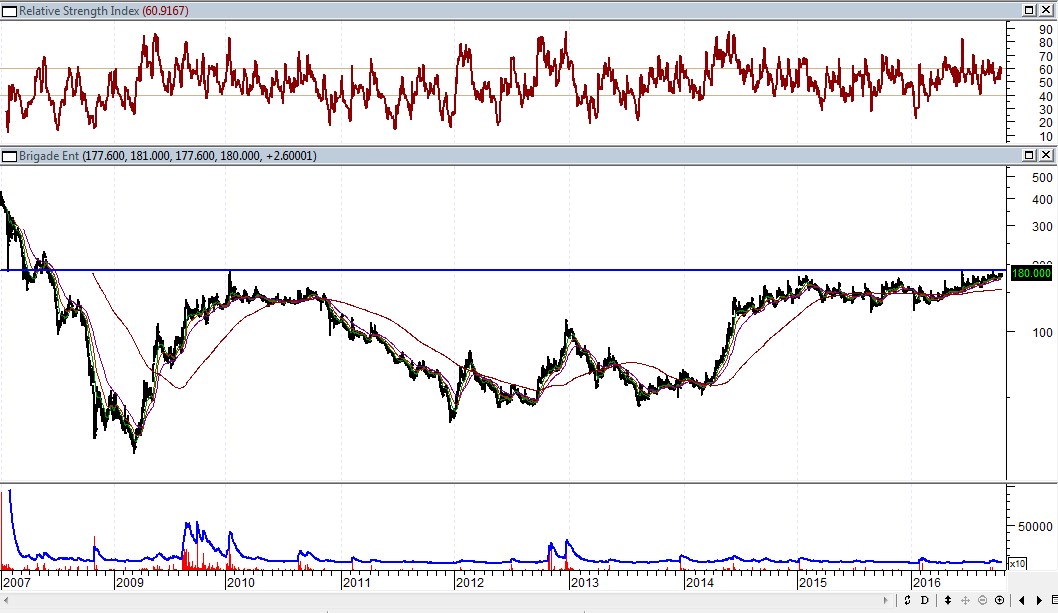
* Technically Good Chart Pattern for reversal - Monthly
swing positive divergence and 2 Bar Positive Divergence on RSI
* As per Elliott wave, Correction Pattern ABC, whereas as
wave C is made a low between 50-61% of Fibonacci level.
* Price is hovering near Monthly Demand Zone
* High Volume at 2 Bar Divergence
* RSI tested near 40 level twice but not breach it.....which
indicates if fall is limited and expecting reversal.
* As per 1 SD Volatility formula, 390 is looks to be maximum
Low if it falls further which is exactly level of 61.8% of Fibonacci level
* If we see reversal, than maximum possible high can be seen
till 487 in the month of November.
Lets plan the monthly positional trade strategy with bullish
bias on pullback if RISK is manageable and affordable .