Pages

Search into this blog

Tuesday, 25 July 2017

Equity Positional - AstraMicro - Probable Triangle Breakout


Astra Microwave Products - CMP - 141.90

Segment  - MID CAP
Risk Category - Medium to High Risk

Why should Stock attractive at current price or if get pullback till 139 : - 
* Triangle Pattern Breakout above 141.50

* Volume is rising at Breakout 
* RSI trend line breakout  above 50
* Good Fundamentals so far.
* Attractive PE 20.91
* Debt to Equity Ratio - 0.29 (Debt Free Stock) 
* Triangle Breakout Target comes near 156 (which is also near all time High)
* Stop Loss 134
* FII Stake Increased in June 2017 

Please note - Financial Result will declared on this Friday 28 July 2017. Fundamental is good so far and hence expecting good result as well. If any negative result, we need to review position after the result date. So Stay well infromed. Thanks. 

Daily Chart - 


Monday, 24 July 2017

Equity Positional - Thangamayil Jwellery - Flag Pattern Breakout - 25 July 2017


Thangamayil Jwellery - CMP 285.50

Segment  - SMALL CAP
Risk Category - High Risk

Why should Stock attractive at current price or if get pullback till 270 - 

* Flag Pattern Breakout or Good Consolidation Breakout above 272 
* Price Sustaining above 200 Moving Average and breakout 
* Volume is rising near Breakout 
* RSI moved above 60 which is bullish zone 
* Fundamental Ratio is getting improving 
* Attractive PE 26.78% 
* Equity Debt Ratio - 0.79 (Almost Debt Free Stock) 
* Flat Target comes near 320 
* Initial Stop 270 (final Stop 230)

Suggested to apply Money Management Strategy to gain to achieve Prudence Risk Reward.


Sunday, 23 July 2017

VEDL - Yogi's CBT Pattern Target Achieved


On 24 June, we have analysed VEDL hourly Chart and during that time its price was in the no trade zone. 

We have analysed it possible move on upside as per our propitiatory CBT Pattern and it works very well as per our secondary view. From trading point of view, we have shared that if breakout above 250 then possible target was 275. Target was achieved exactly.

You can observed it following latest chart and previous last month chart. 


Old Chart shared on our blog on 24 June 2017

You can also review our previous post or all the post with label "VEDL". 
The same link is below. 

http://yogeshtamkhade.blogspot.com/search/label/VEDL


Saturday, 24 June 2017

VEDL - No trade Zone - Analyzing Possibilities of further move


Primary View - Sideways Action - Both side open - 
Study of Elliot wave suggest sideways to bearishness until upside break of 250 level. Above 250 will be Bullish zone... which support on my secondary view on next chart.
Below 220 is bearish zone which support wave analysis. 
Between 220 -250 is no trade zone as per me.... Better to stay away between these zone. 


Secondary View -  It is simplest technical pattern approach of base formation seen bottom which might conclude to move of previous swing high if break above 250. 


Friday, 23 June 2017

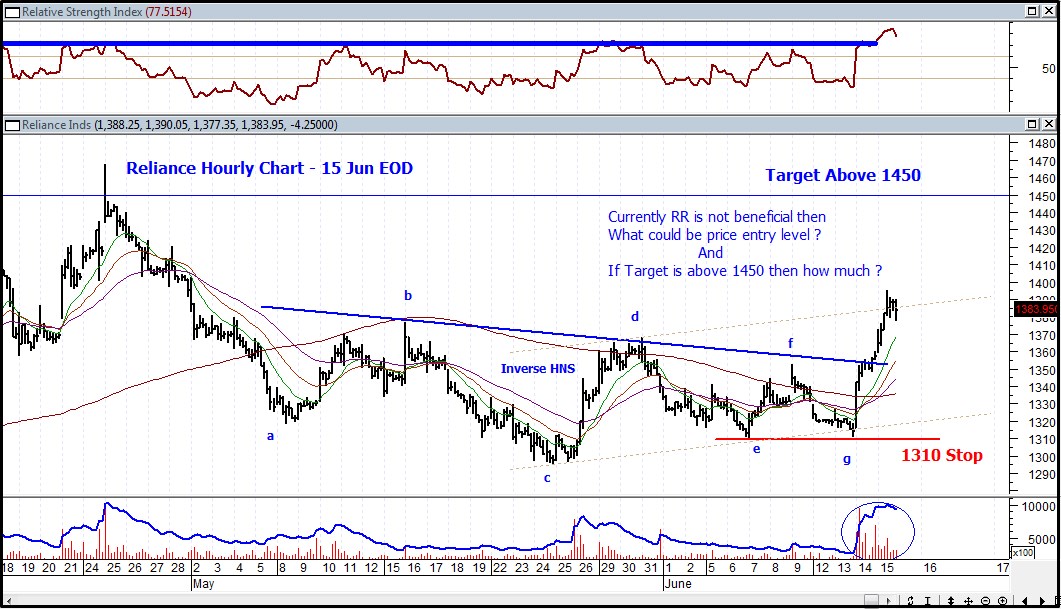
Reliance Ind - Target is almost achieved 5 days(4.5% Gain)


Reliance Ind - Target is almost achieved 5 days(4.5% Gain) but our question remain unanswered.....

1) Entry if not favorable as per RR? --- it was missed now.
2) Target if Price cross above 1450?

still you have time to answer?


Look for previous post on Reliance Industry - 

http://yogeshtamkhade.blogspot.in/2017/06/reliance-industry-is-it-tradable-trade.html

Thursday, 15 June 2017

Reliance Industry - is it tradable trade Setup ????


Will You Trade this setup now or will you wait for Pullback ???

Stop Loss And Target is defined....

Try to Find the Entry level ..... 

Write Down your Answer in your trading dairy and comment after either of exit level passed. 

Chart Shared for Study Purpose :-)  


All kind of comments are welcome related to study!!! 

Wednesday, 14 June 2017

Apollo Tyre - Update : Booked Partially on 27% return and Hold rest


Apollo Tyre - 

- Journey from 20 Mar 2017 at price 204 based on the Technical and Wave Analysis.
- Booked Partially Here and Hold rest.
- Hold Rest as we price is still in 3 wave but not able to catch current pattern form. This 3rd wave could be extendable till 161.8%. It could be form of Terminal impulse. Further price movement will unfold the path...

Lets Wait and Watch!!!