Search into this blog
Saturday, 27 August 2016
S H KELKAR & CO. - Good To have in Long term Portfolio
S H Kelkar is recently launched IPO, 9 month baby in the secondary market - now growing quickly.
After initial triangular consolidation, giving breakout on July and than within 2 months gave 50% rise in the price.
This baby has to be in the portfolio for long term, hence accumulate this stock on every correction.
Tuesday, 23 August 2016
Nifty Analysis - Near to Completion of Diametric Pattern
Nifty Daily Chart -
Complex Wave Correction (ABC-X-ABC) seen in the Nifty daily Chart below. Whereas first & Second B wave correction looks like Diametric Pattern.
Diametric Pattern is 7 legs corrective pattern and variation of Triangle Pattern as per Neo Wave analysis. This forms by combination of Expanding and Contracting triangle. This is Exactly opposite of Bow Tie Diametric Formation which forms by combination of Contracting first and than Expanding Triangle (seen below in the RSI chart).

In Above Chart of Nifty, 2nd B wave is nearly completion of as current price is in last 'g' leg of diametric. Reversal to upside for "C" Wave is still yet to confirm and hopefully we will get in the remaining days of this week itself.
8518 and further 8475 is key support for this rally and breach of the level will invalidate the pattern.
Purpose of sharing this Chart for study Analysis and Nifty is standing near to Make or Break level. Thanks.
Happy Trading!!!
Yogi :-)
Complex Wave Correction (ABC-X-ABC) seen in the Nifty daily Chart below. Whereas first & Second B wave correction looks like Diametric Pattern.
Diametric Pattern is 7 legs corrective pattern and variation of Triangle Pattern as per Neo Wave analysis. This forms by combination of Expanding and Contracting triangle. This is Exactly opposite of Bow Tie Diametric Formation which forms by combination of Contracting first and than Expanding Triangle (seen below in the RSI chart).

In Above Chart of Nifty, 2nd B wave is nearly completion of as current price is in last 'g' leg of diametric. Reversal to upside for "C" Wave is still yet to confirm and hopefully we will get in the remaining days of this week itself.
8518 and further 8475 is key support for this rally and breach of the level will invalidate the pattern.
Purpose of sharing this Chart for study Analysis and Nifty is standing near to Make or Break level. Thanks.
Happy Trading!!!
Yogi :-)
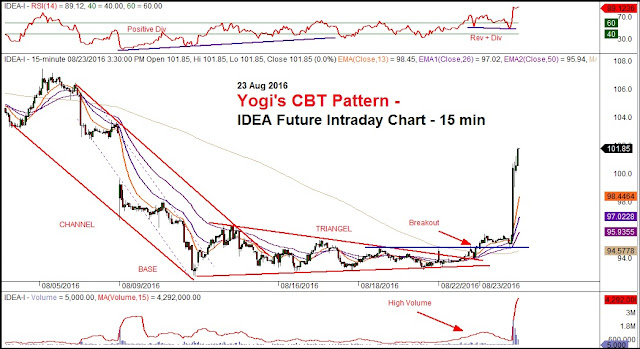
IDEA - 15 min Future Chart - Breakout of Yogi's CBT Pattern today
Monday, 15 August 2016
HERO MOTOR CORP - Yogi's CBT Pattern Target Acheived
Sunday, 14 August 2016
V-GUARD - 42% Price Appreciation in 3 months after recommendation
Check all Previous Post of V-GUARD for reference -
https://yogeshtamkhade.blogspot.in/search/label/VGuard
Present Chart (15 Aug 2016) - Anticipation Successfully
Daily Chart Recommended on 28 May 2016 -
Morepen Labs - Result News_10 August 2016
Check all previous Post of Morepen Labs -
http://yogeshtamkhade.blogspot.in/search/label/Morepen%20Lab
1st Quater Result for 2016-2017 Financial Result -

http://yogeshtamkhade.blogspot.in/search/label/Morepen%20Lab
1st Quater Result for 2016-2017 Financial Result -

Thursday, 4 August 2016
Yogi's CBT Pattern Example - Hexaware Technology
Yesterday, I have revealed the existence of Yogi's CBT pattern in Manappuram Finance and shared the same on Social media.
I got many appreciation from the trader and Investor community for the inventing this pattern. You will also seen movement after this pattern breakout.
Similarly, I got argument from one of the trader as well that it is simple technique of the tread line breakout and why are you showcasing as secret revealed pattern.
Yes, Anyone can capture this rally with trend line breakout. but not all trendline breakout works with this potential....
CBT Pattern gives the confidence to ride on the rally and its breakout works like stiff rally.... Rare question of failure, though i have not seen so... might be possible!!!
It is simple logic with simple, basic technical tools but combine it with powerful setup to which i named as CBT Pattern. It is just the way i look at it charts for trading or Investment purpose.. Thanks
Below is the historical chart of Hexaware Technology where i located the existence of Yogi's CBT pattern in year 2013 sharing here for reference purpose.
Wednesday, 3 August 2016
Manappuram Finance - CBT Pattern Breakout
CBT Pattern - Channel, Base and Triangle Pattern
Mostly Trend reversal happen with faster movement and momentum which we can observed easily but if it is not so than how to identify the trend reversal with slow momentum?
CBT pattern will help us to identify the end of long time correction and breakout entry for trend reversal...
CBT nothing but combination of simple Channel and Triangle pattern with BASE formation. You can very understand from the Chart shown below.
This Pattern is not written any book. It is observed and revealed by YOGI Research.
We will share more charts on the same pattern whenever time permits.
Subscribe to:
Comments (Atom)


